RFQ Lifecycle Analytics
Track sourcing performance with P90 cycle time metrics across every stage of your RFQ process
Last updated 25 July 2026
RFQ Lifecycle Analytics provides visibility into how long each stage of your procurement process takes. By tracking cycle times from creation to closing, you can identify bottlenecks, measure improvement over time, and benchmark your team's performance.
Why We Track P90
ProcureFlow uses P90 (90th percentile) as the primary metric for cycle time analysis rather than averages. Here's why:
| Metric | What it measures | Limitation |
|---|---|---|
| Average | Mean time across all RFQs | Outliers skew the result—a single delayed RFQ can make performance look worse than it is |
| P90 | 90% of RFQs complete within this time | Provides a realistic upper bound while filtering out extreme outliers |
Example: If your P90 for "Supplier Bidding" is 7 days, that means 90% of your RFQs complete their bidding window within 7 days. The remaining 10% may include exceptional cases—custom specifications, hard-to-source items, or supplier holidays.
P90 helps you:
- Set realistic SLAs with stakeholders based on achievable timelines
- Identify systemic issues without being distracted by one-off delays
- Track improvement as process changes take effect
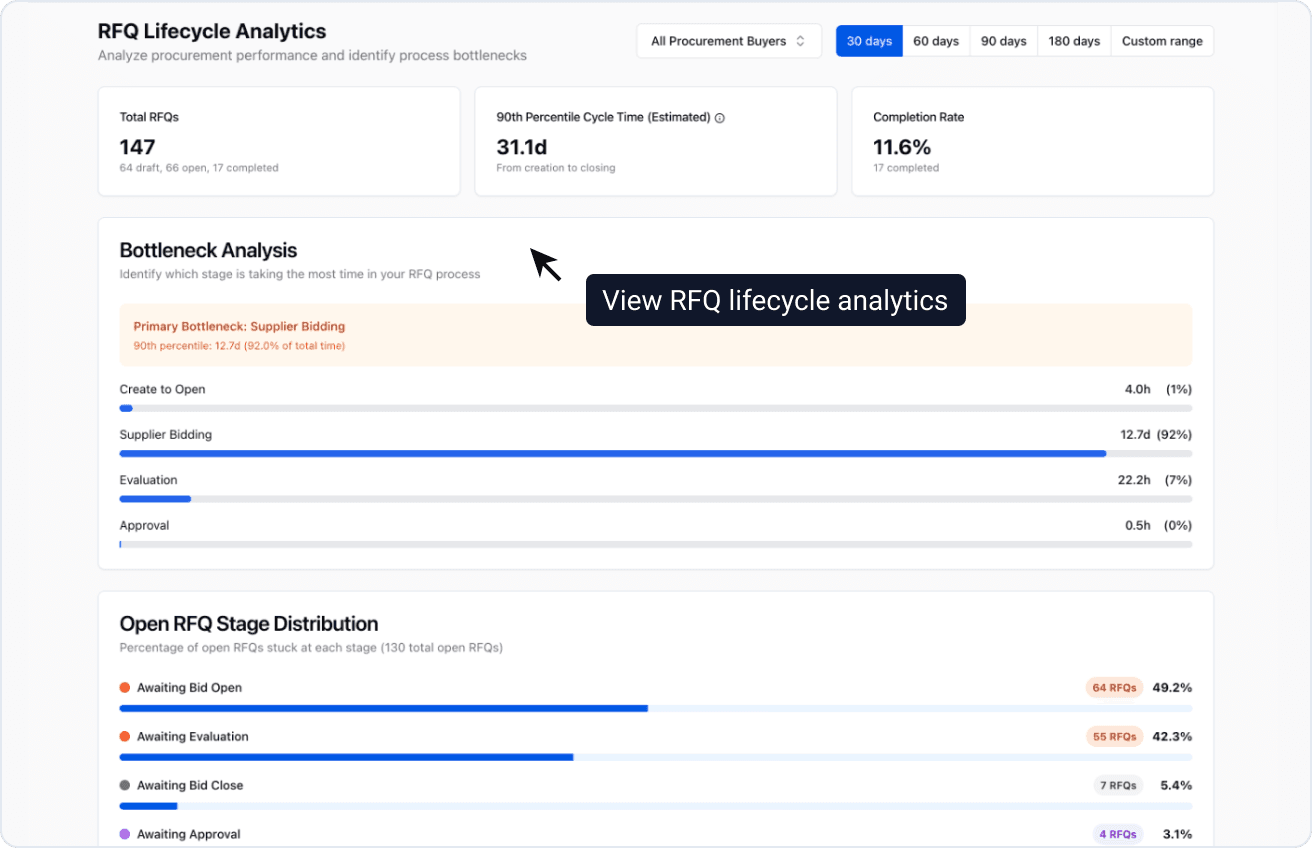
Dashboard Overview
The RFQ Lifecycle Analytics dashboard is organized into several sections, each providing different insights into your procurement performance.
Summary Cards
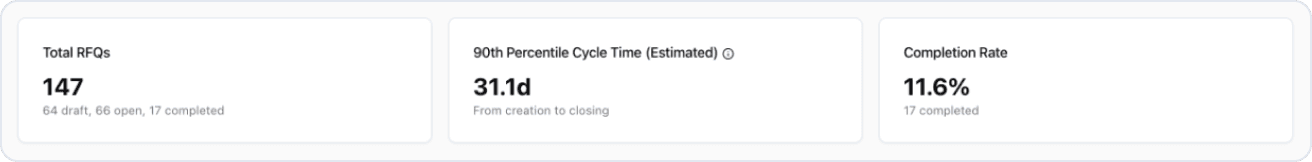
Three cards at the top provide a quick snapshot of your RFQ performance:
| Card | What it shows |
|---|---|
| Total RFQs | Count of all RFQs in the selected period, broken down by draft, open, and completed |
| 90th Percentile Cycle Time | P90 time from RFQ creation to closing. Shows "Estimated" when completion rate is below 45% |
| Completion Rate | Percentage of RFQs that have been completed within the selected period |
Bottleneck Analysis
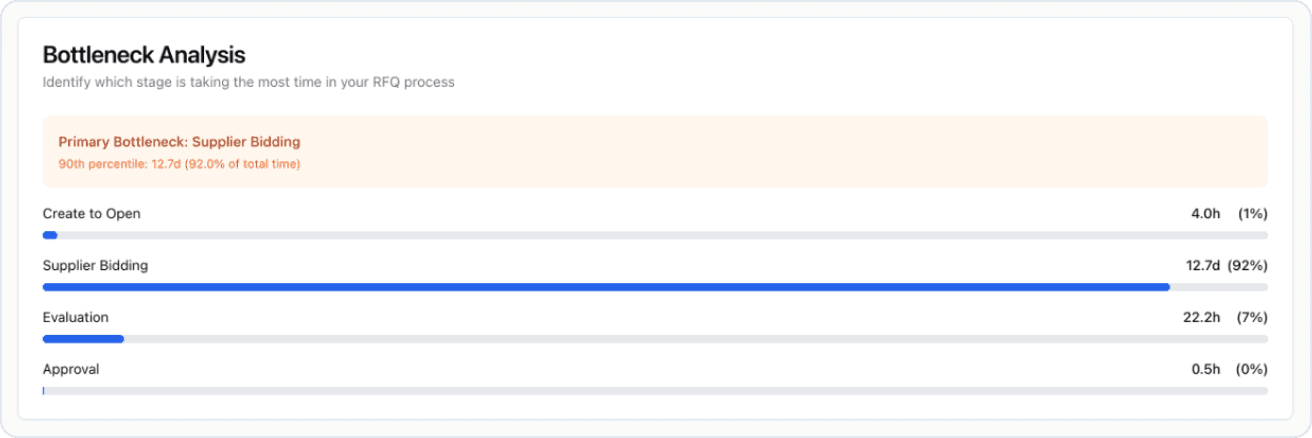
The Bottleneck Analysis section identifies which stage of your RFQ process is taking the most time. This helps you focus improvement efforts where they'll have the greatest impact.
The dashboard highlights your Primary Bottleneck—the stage with the longest P90 duration—and shows a visual breakdown of time spent in each stage as a percentage of total cycle time.
RFQ Lifecycle Stages
ProcureFlow tracks four stages in the RFQ lifecycle:
flowchart LR
    A[Create to Open] --> B[Supplier Bidding]
    B --> C[Evaluation]
C --> D[Approval]| Stage | What it measures | What delays reveal |
|---|---|---|
| Create to Open | Time from RFQ creation to when bidding opens | Internal processing delays, approval queue bottlenecks, or sourcing team capacity constraints |
| Supplier Bidding | Time from bidding open to bid closing | Bid window configuration, supplier engagement levels, or specification clarity issues |
| Evaluation | Time from bid closing to evaluation completion | Evaluation complexity, evaluator availability, or unclear evaluation criteria |
| Approval | Time from evaluation completion to RFQ closing | Approval workflow efficiency or decision-maker availability |
Stage Distribution
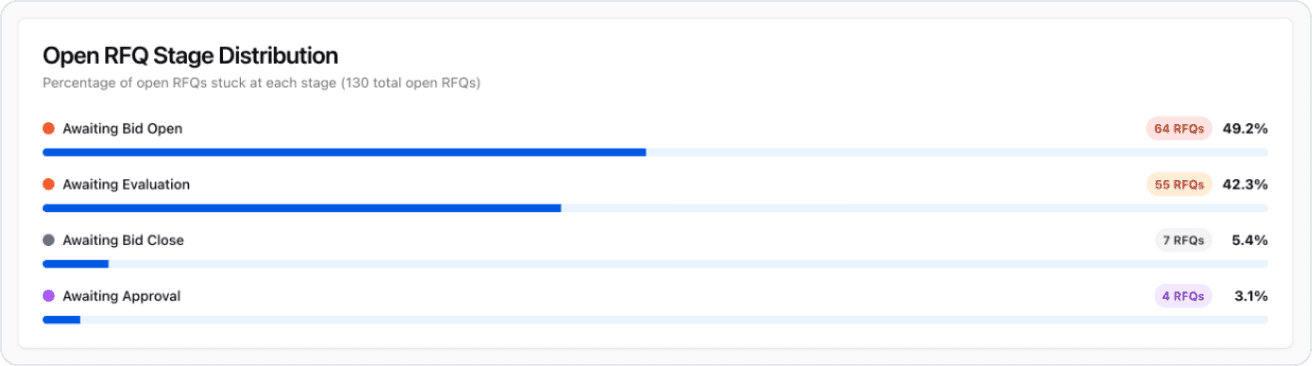
This section shows how your currently open RFQs are distributed across stages:
- Awaiting Bid Open — RFQs created but not yet opened for bidding
- Awaiting Bid Close — RFQs currently accepting bids
- Awaiting Evaluation — Bidding has closed, pending evaluation
- Awaiting Approval — Evaluation complete, pending final approval
Use this to identify where work is piling up. A large number of RFQs stuck in one stage may indicate a process bottleneck that needs attention.
Slowest RFQs Analysis
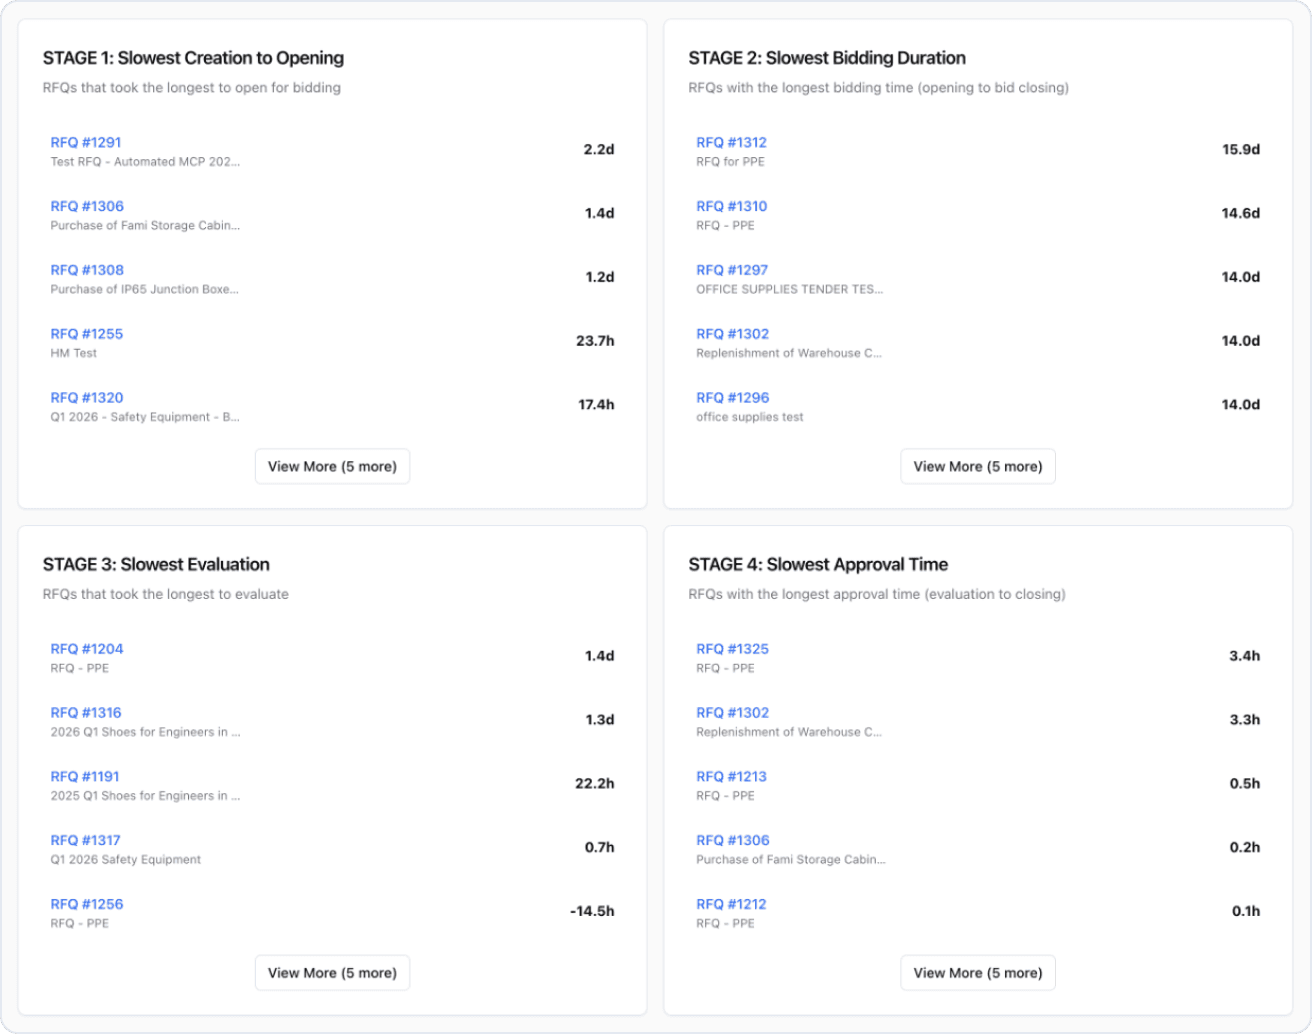
Four cards show the top 10 slowest RFQs for each stage, helping you identify specific procurements that may need intervention:
- Slowest Creation to Opening — RFQs that took the longest to open for bidding
- Slowest Bidding Duration — RFQs with the longest time between opening and bid closing
- Slowest Evaluation — RFQs that took the longest to evaluate
- Slowest Approval Time — RFQs with the longest approval duration
Each card shows the RFQ number, subject, and duration in hours. Click on any RFQ to investigate further.
Weekly Trends Chart
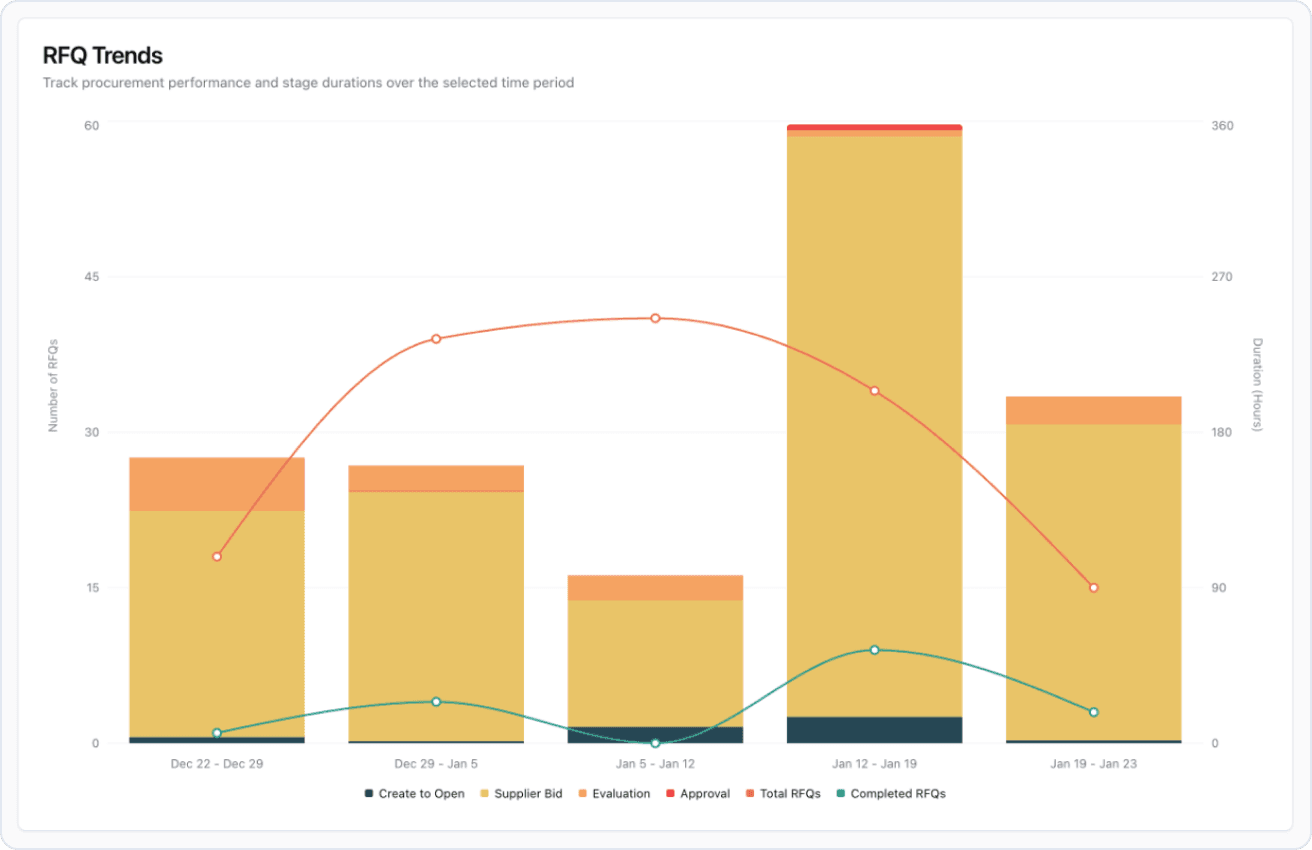
The trends chart displays your RFQ performance over time, broken down by week. Track:
- Total RFQs created per week
- Completed RFQs per week
- P90 cycle time trends for each stage
Use this to identify whether your process improvements are having an impact and to spot any emerging issues early.
Longest-Running Open RFQs
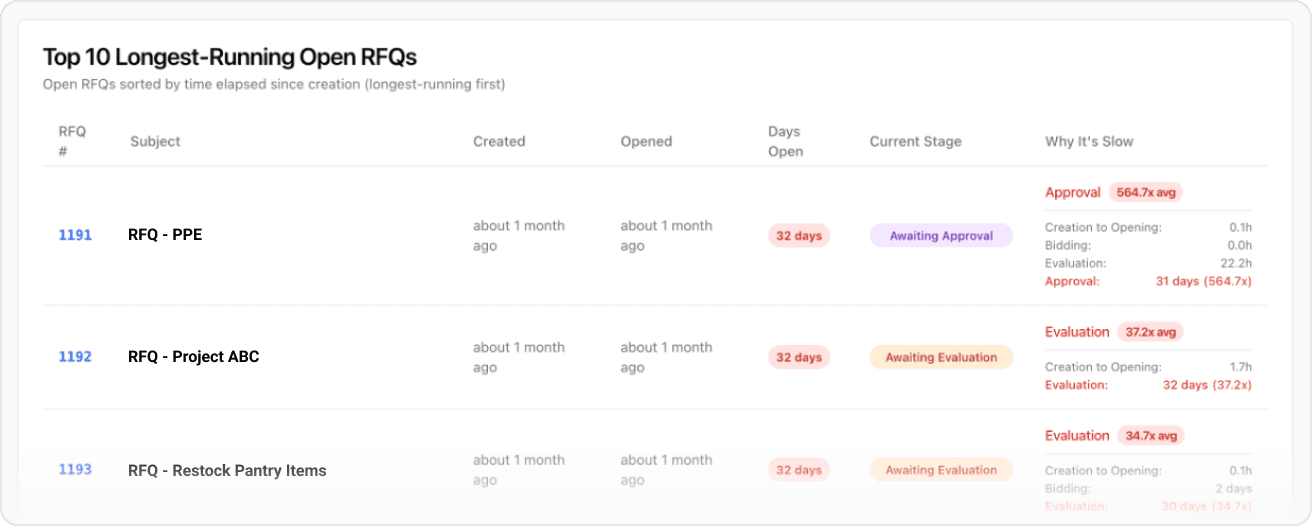
This table shows your top 10 longest-running open RFQs, sorted by days elapsed since creation. For each RFQ, you can see:
| Column | Description |
|---|---|
| RFQ # | Reference number (click to open the RFQ) |
| Subject | RFQ description |
| Created | When the RFQ was created |
| Opened | When bidding was opened (if applicable) |
| Days Open | Total days since creation |
| Current Stage | Where the RFQ is in the process |
| Why It's Slow | Which stage is taking abnormally long compared to your organization's average |
Understanding "Why It's Slow"
The system compares each stage's duration against your organization's historical average. When a stage exceeds 1.5x the average, it's flagged as abnormal. The multiplier (e.g., "3.2x avg") shows how much slower that stage is compared to typical performance.
Stages are color-coded by severity:
- Yellow (1.5x-3x) — Moderately slower than average
- Orange (3x-5x) — Significantly slower than average
- Red (5x+) — Critically slower than average
If all stages are performing within 1.5x of average, the RFQ is marked as "All normal"—it's taking long due to cumulative time across all stages rather than any specific bottleneck.
Using the Dashboard
Filtering Data
Apply filters to analyze specific segments:
- Date range: Select preset ranges (30, 60, 90 days) or custom date ranges
- Buyer: Filter by the sourcing team member responsible for the RFQ
Interpreting Trends
When reviewing weekly trends, look for:
- Improving P90: Process changes are working
- Stable P90: Consistent performance, potential for optimization
- Worsening P90: Investigate recent changes—team capacity, supplier issues, or policy changes
Related Reports
ProcureFlow offers additional analytics to complement RFQ lifecycle tracking:
- Negotiated Savings Trend: Track cost reductions achieved through BAFO rounds and competitive bidding
- Purchase Order Analytics: Monitor PO volumes, values, and supplier distribution
- Organisation Usage Metrics: Understand platform adoption across teams
- Supplier Usage Metrics: Evaluate supplier participation and performance
- Scheduled Data Reports: Automate recurring analytics delivery to stakeholders